
After the intense practice for the SAT exam, now we are focusing on pre-calculus. We flew through the few chapters since we knew most of the stuffs in it. As I’ve mentioned in my previous posts, we use a lot of Khan Academy as our source to further our learning.
One of the part that interest me the most is learning to sketch a polynomial graph. Before I was introduced to pre-calculus I only use to see a parabola graph-shape looking graph but now graphing a polynomial is a much cooler graph(in my opinion). To draw sketch a polynomial functions graph, you need to follow a few steps.
Step 1: Find all of the x-intercepts of graph.
Step 2: Make a table of values for the polynomial. Include test points to know whether the graph of the polynomial lies above or below the x-axis on the intervals determined by the zeros. Include the y-intercept in the table.
Step 3: Determine the end behavior of the polynomial.
Step 4: Plot all the intercept and other points you found in the table. Then sketch the graph.
Using Desmos, this is the difference between a quadratic and a polynomial graph(bigger power).
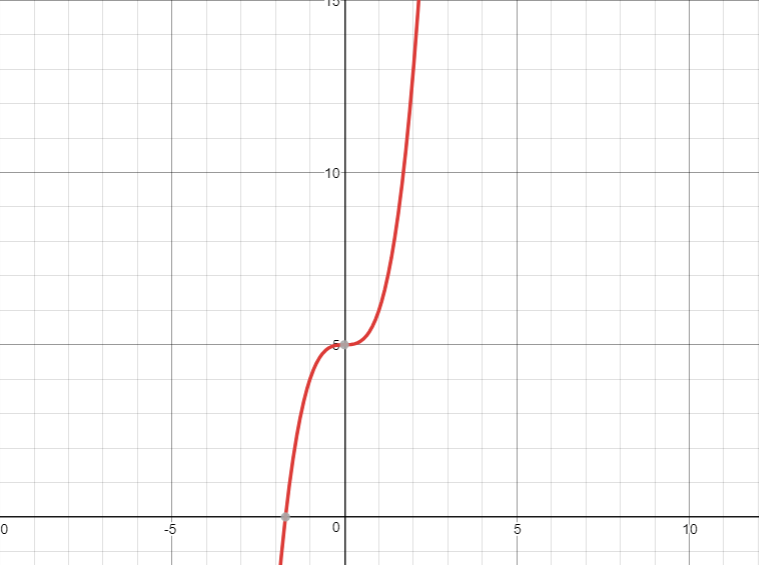
This is the graph of : x^3+5
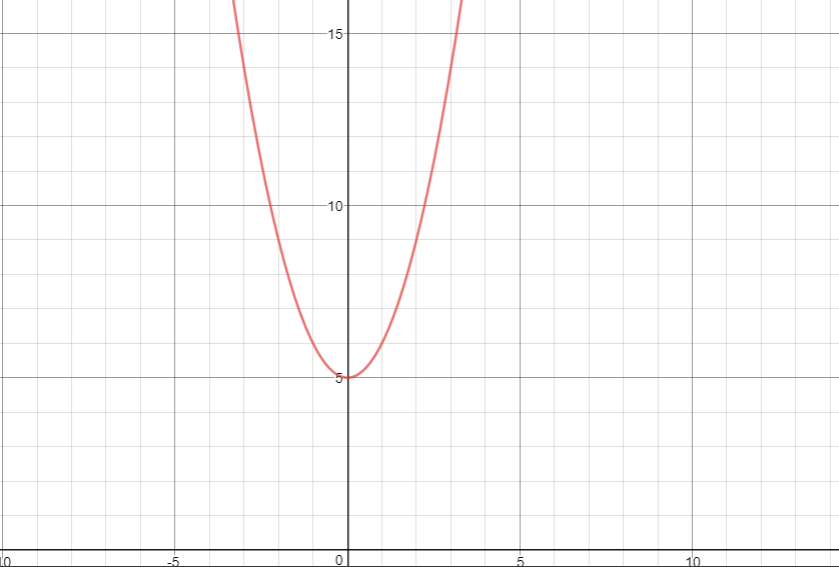
This is the graph of: x^2+5